yasa.Hypnogram.plot_hypnodensity#
- Hypnogram.plot_hypnodensity(palette=None, ax=None)[source]#
Plot the hypnodensity: per-epoch stage probabilities as a stacked area chart.
Requires that the
probaattribute is set (i.e. the hypnogram was created byyasa.SleepStaging.predict).- Parameters:
- palettedict or None
A dictionary mapping stage names to matplotlib colors, e.g.
{"WAKE": "#99d7f1", "REM": "xkcd:sunflower"}. WhenNone(default), a built-in palette is used. Missing stage keys fall back to"gray".- ax
matplotlib.axes.Axesor None Axis on which to draw the plot. If
None(default), the current axis is used.
- Returns:
- ax
matplotlib.axes.Axes Matplotlib Axes
- ax
- Raises:
- ValueError
If
probaisNone.
Examples
5-stage hypnogram:
>>> import numpy as np
>>> import pandas as pd
>>> from yasa import Hypnogram, simulate_hypnogram
>>> import matplotlib.pyplot as plt
>>> hyp = simulate_hypnogram(tib=300, n_stages=5, seed=42)
>>> stages = ["WAKE", "N1", "N2", "N3", "REM"]
>>> rng = np.random.default_rng(42)
>>> one_hot = (
...     pd.get_dummies(hyp.hypno)
...     .reindex(columns=stages, fill_value=0)
...     .to_numpy(dtype=float)
... )
>>> noise = rng.dirichlet(np.ones(5) * 0.5, size=hyp.n_epochs)
>>> raw = 0.75 * one_hot + 0.25 * noise
>>> proba = pd.DataFrame(raw / raw.sum(axis=1, keepdims=True), columns=stages)
>>> ax = Hypnogram(hyp.hypno, n_stages=5, proba=proba).plot_hypnodensity()
>>> plt.tight_layout()

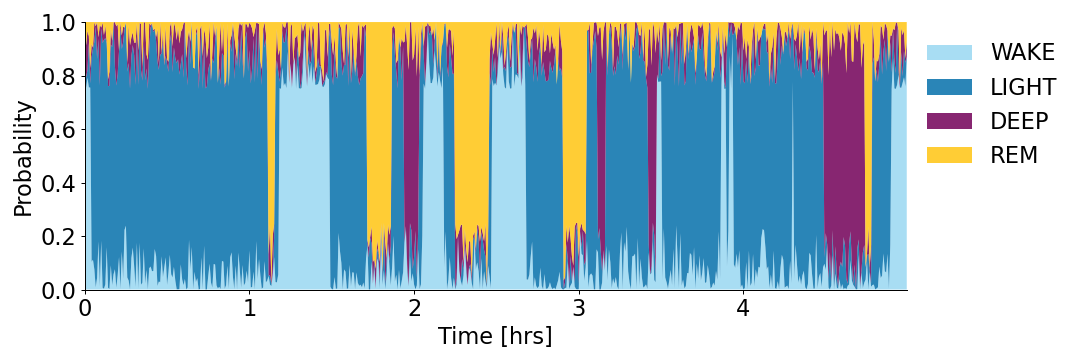
4-stage hypnogram:
>>> import numpy as np
>>> import pandas as pd
>>> from yasa import Hypnogram, simulate_hypnogram
>>> import matplotlib.pyplot as plt
>>> hyp = simulate_hypnogram(tib=300, n_stages=4, seed=42)
>>> stages = ["WAKE", "LIGHT", "DEEP", "REM"]
>>> rng = np.random.default_rng(42)
>>> one_hot = (
...     pd.get_dummies(hyp.hypno)
...     .reindex(columns=stages, fill_value=0)
...     .to_numpy(dtype=float)
... )
>>> noise = rng.dirichlet(np.ones(4) * 0.5, size=hyp.n_epochs)
>>> raw = 0.75 * one_hot + 0.25 * noise
>>> proba = pd.DataFrame(raw / raw.sum(axis=1, keepdims=True), columns=stages)
>>> ax = Hypnogram(hyp.hypno, n_stages=4, proba=proba).plot_hypnodensity()
>>> plt.tight_layout()
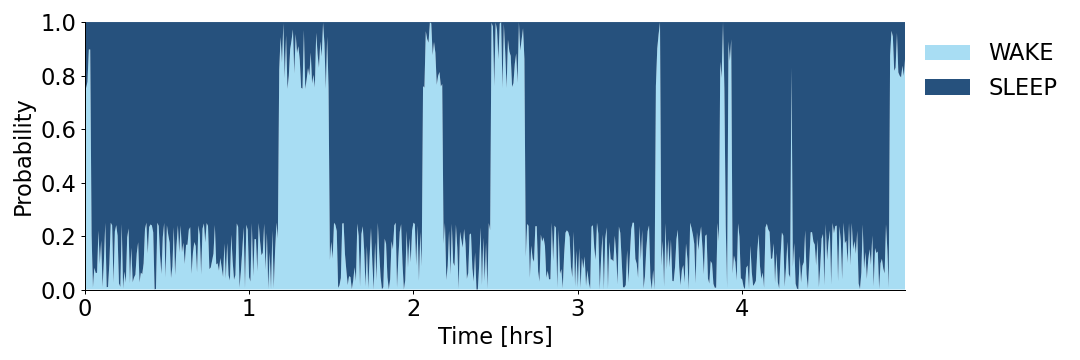
2-stage hypnogram:
>>> import numpy as np
>>> import pandas as pd
>>> from yasa import Hypnogram, simulate_hypnogram
>>> import matplotlib.pyplot as plt
>>> hyp = simulate_hypnogram(tib=300, n_stages=2, seed=42)
>>> stages = ["WAKE", "SLEEP"]
>>> rng = np.random.default_rng(42)
>>> one_hot = (
...     pd.get_dummies(hyp.hypno)
...     .reindex(columns=stages, fill_value=0)
...     .to_numpy(dtype=float)
... )
>>> noise = rng.dirichlet(np.ones(2) * 0.5, size=hyp.n_epochs)
>>> raw = 0.75 * one_hot + 0.25 * noise
>>> proba = pd.DataFrame(raw / raw.sum(axis=1, keepdims=True), columns=stages)
>>> ax = Hypnogram(hyp.hypno, n_stages=2, proba=proba).plot_hypnodensity()
>>> plt.tight_layout()