yasa.SleepStatsAgreement.plot_blandaltman#
- SleepStatsAgreement.plot_blandaltman(sleep_stats=None, bias_method='auto', loa_method='auto', ci_method='auto', flag_biased=False, scatter_kwargs=None, **kwargs)[source]#
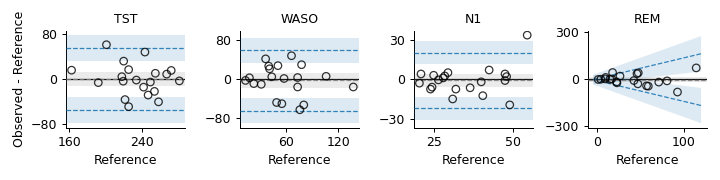
Plot Bland-Altman agreement plots for one or more sleep statistics.
Each panel shows observed-minus-reference differences (y-axis) against reference values (x-axis) for one sleep statistic. Bias and limits of agreement are drawn as lines, with optional confidence-interval bands. Methods (parametric, regression, or bootstrap) are chosen automatically per statistic based on the assumption tests stored in
assumptions, or can be set explicitly.- Parameters:
- sleep_statslist or None
List of sleep statistics to plot. Default (None) is to plot all sleep statistics.
- bias_methodstr
If
'param', bias is always the mean difference (horizontal line). If'regr', bias is always a regression line. If'auto'(default), the method is chosen per statistic based on the proportional-bias assumption test.- loa_methodstr
Method used to draw limits of agreement. Options:
'param'— constant LoA: horizontal lines atbias ± 1.96 SD. Always uses this form regardless of assumptions orlog_transform.'regr'— regression LoA: lines followingb0 + b1 × ref. Always uses this form regardless of assumptions orlog_transform.'log'— Euser LoA: lines followingbias ± slope × ref. Requireslog_transform=True; raisesValueErrorotherwise.'auto'(default) — iflog_transform=True, always uses'log'. Otherwise, uses'param'when the homoscedasticity assumption passes and'regr'when it fails.
- ci_methodstr or None
If
'param', parametric CIs are drawn. If'boot', bootstrap CIs are drawn. If'auto'(default), chosen per statistic based on the normality assumption test. IfNone, no confidence intervals are drawn.- flag_biasedbool
If True, sleep statistics with a statistically significant bias (i.e., the
unbiasedassumption is violated) are drawn with a red bias line instead of grey.- scatter_kwargsdict
Other keyword arguments are passed through to
matplotlib.pyplot.scatter.- **kwargsdict
Other keyword arguments are passed through to
seaborn.FacetGrid.
- Returns:
- g
seaborn.FacetGrid Seaborn FacetGrid
- g
Examples
>>> import yasa
>>> n = 20
>>> ref_hyps = [yasa.simulate_hypnogram(scorer="PSG", seed=i) for i in range(n)]
>>> obs_hyps = [ref_hyps[i].simulate_similar(scorer="Device", seed=i) for i in range(n)]
>>> eea = yasa.EpochByEpochAgreement(ref_hyps, obs_hyps)
>>> sstats = eea.get_sleep_stats()
>>> ssa = yasa.SleepStatsAgreement(sstats.loc["PSG"], sstats.loc["Device"])
>>> stats = ["TST", "WASO", "N1", "REM"]
>>> g = ssa.plot_blandaltman(sleep_stats=stats, ci_method="param")