yasa.plot_spectrogram#
- yasa.plot_spectrogram(data, sf, hypno=None, win_sec=30, fmin=0.5, fmax=25, trimperc=2.5, cmap='RdBu_r', vmin=None, vmax=None, **kwargs)[source]#
Plot a full-night multi-taper spectrogram, optionally with the hypnogram on top.
For more details, please refer to the Jupyter notebook
Added in version 0.1.8.
- Parameters:
- data
numpy.ndarray Single-channel EEG data. Must be a 1D NumPy array.
- sffloat
The sampling frequency of data AND the hypnogram.
- hypnoarray_like or
yasa.Hypnogram Sleep stage (hypnogram), optional.
Can be an upsampled integer array (same number of samples as
data) or ayasa.Hypnograminstance (automatically upsampled). When ayasa.Hypnogramis passed, the hypnogram is used directly for plotting.To manually upsample an integer array, use
yasa.Hypnogram.upsample_to_dataoryasa.hypno_upsample_to_data.Note
When passing an integer array, hypnogram values follow this mapping:
-2 = Unscored
-1 = Artefact / Movement
0 = Wake
1 = N1 sleep
2 = N2 sleep
3 = N3 sleep
4 = REM sleep
- win_secint or float
The length of the sliding window, in seconds, used for multitaper PSD calculation. Default is 30 seconds. Note that
datamust be at least twice longer thanwin_sec(e.g. 60 seconds).- fmin, fmaxint or float
The lower and upper frequency of the spectrogram. Default 0.5 to 25 Hz.
- trimpercint or float
The amount of data to trim on both ends of the distribution when normalizing the colormap. This parameter directly impacts the contrast of the spectrogram plot (higher values = higher contrast). Default is 2.5, meaning that the min and max of the colormap are defined as the 2.5 and 97.5 percentiles of the spectrogram.
- cmapstr
Colormap. Default to ‘RdBu_r’.
- vminint or float
The lower range of color scale. Overwrites
trimperc- vmaxint or float
The upper range of color scale. Overwrites
trimperc- **kwargsdict
Other arguments that are passed to
yasa.Hypnogram.plot_hypnogram.
- data
- Returns:
- fig
matplotlib.figure.Figure Matplotlib Figure
- fig
Examples
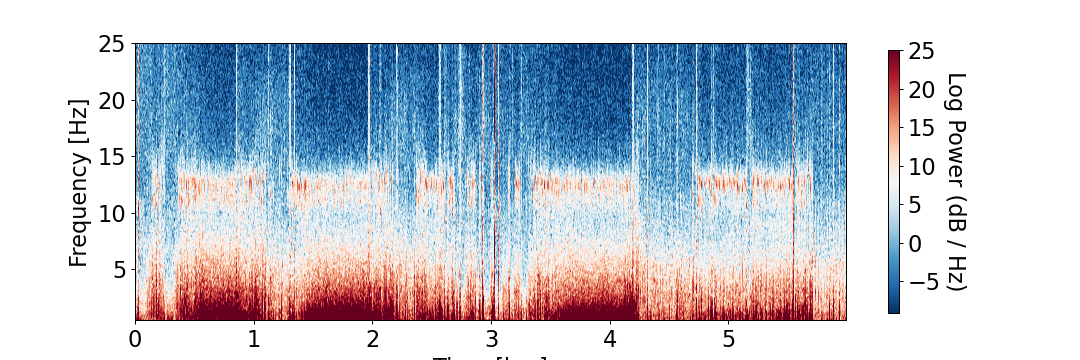
Full-night multitaper spectrogram on Cz, no hypnogram
>>> import yasa
>>> import numpy as np
>>> fpath = yasa.fetch_sample("full_6hrs_100Hz_Cz+Fz+Pz.npz")
>>> npz = np.load(fpath)
>>> data = npz["data"][0, :]
>>> sf = 100
>>> fig = yasa.plot_spectrogram(data, sf)
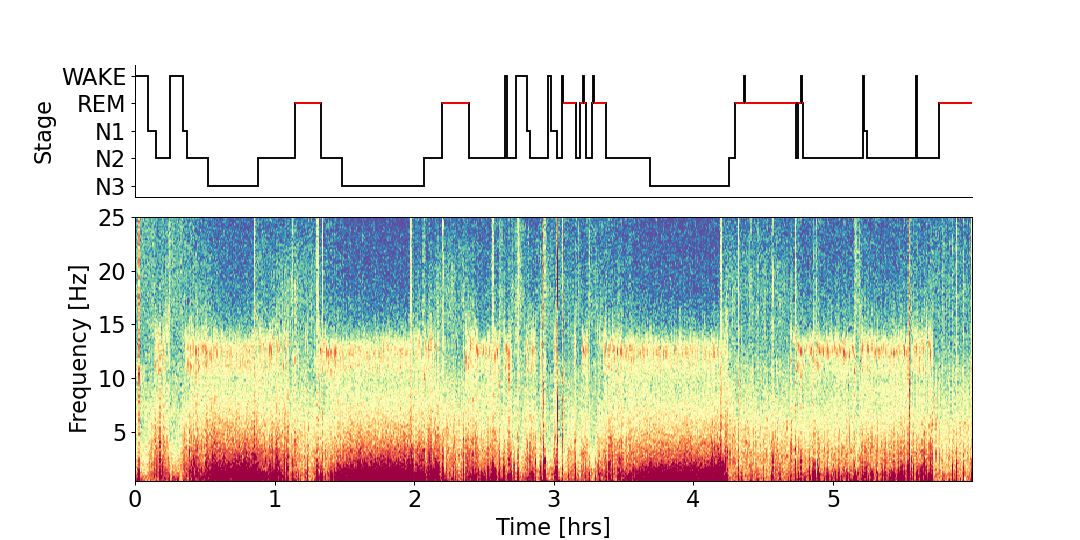
Full-night multitaper spectrogram on Cz with the hypnogram on top (legacy integer array)
>>> import yasa
>>> import numpy as np
>>> fpath = yasa.fetch_sample("full_6hrs_100Hz_Cz+Fz+Pz.npz")
>>> npz = np.load(fpath)
>>> data = npz["data"][0, :]
>>> sf = 100
>>> hypno = np.loadtxt(yasa.fetch_sample("full_6hrs_100Hz_hypno_30s.txt"))
>>> hypno = yasa.hypno_upsample_to_data(hypno, 1 / 30, data, sf)
>>> fig = yasa.plot_spectrogram(data, sf, hypno, cmap="Spectral_r")
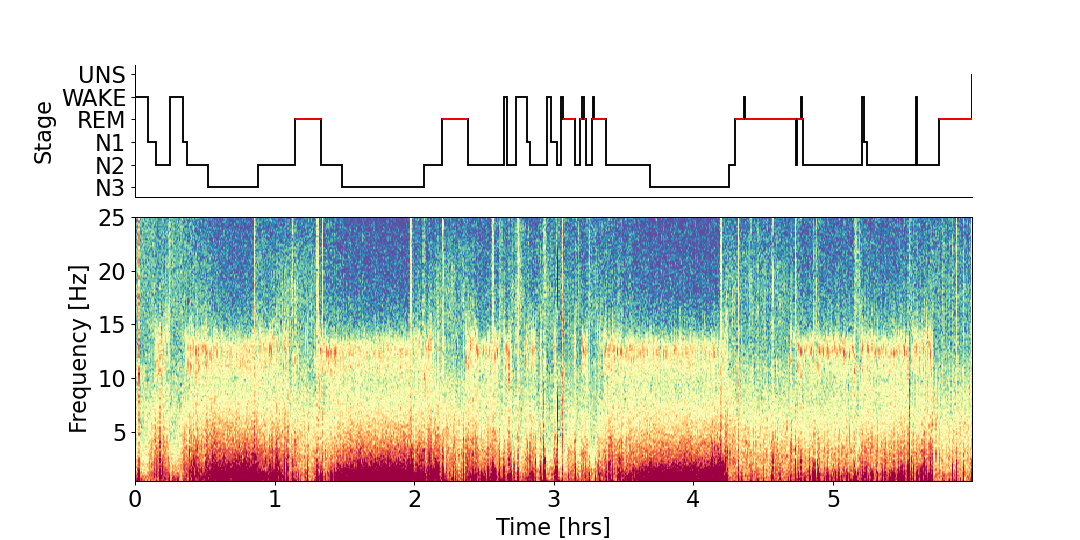
Same plot using a
Hypnogramdirectly — no upsampling needed:
>>> import yasa
>>> import numpy as np
>>> fpath = yasa.fetch_sample("full_6hrs_100Hz_Cz+Fz+Pz.npz")
>>> npz = np.load(fpath)
>>> data = npz["data"][0, :]
>>> sf = 100
>>> hypno_30s = yasa.hypno_int_to_str(
...     np.loadtxt(yasa.fetch_sample("full_6hrs_100Hz_hypno_30s.txt")).astype(int)
... )
>>> hyp = yasa.Hypnogram(hypno_30s, freq="30s")
>>> fig = yasa.plot_spectrogram(data, sf, hyp, cmap="Spectral_r")