yasa.topoplot#
- yasa.topoplot(data, montage='standard_1020', vmin=None, vmax=None, mask=None, title=None, cmap=None, n_colors=100, cbar_title=None, cbar_ticks=None, figsize=(4, 4), dpi=80, fontsize=14, ax=None, **kwargs)[source]#
Topoplot.
This is a wrapper around
mne.viz.plot_topomap.For more details, please refer to this example notebook.
Added in version 0.4.1.
- Parameters:
- data
pandas.Series A pandas Series with the values to plot. The index MUST be the channel names (e.g. [‘C4’, ‘F4’] or [‘C4-M1’, ‘C3-M2’]).
- montagestr
The name of the montage to use. Valid montages can be found at
mne.channels.make_standard_montage.- vmin, vmaxfloat
The minimum and maximum values of the colormap. If None, these will be defined based on the min / max values of
data.- mask
pandas.Series A pandas Series indicating the significant electrodes. The index MUST be the channel names (e.g. [‘C4’, ‘F4’] or [‘C4-M1’, ‘C3-M2’]).
- titlestr
The plot title.
- cmapstr
A matplotlib color palette. A list of color palette can be found at: https://seaborn.pydata.org/tutorial/color_palettes.html
- n_colorsint
The number of colors to discretize the color palette.
- cbar_titlestr
The title of the colorbar.
- cbar_tickslist
The ticks of the colorbar.
- figsizetuple
Width, height in inches.
- dpiint
The resolution of the plot.
- fontsizeint
Global font size of all the elements of the plot.
- ax
matplotlib.axes.Axesor None Axes on which to draw the topoplot. If None (default), a new figure and axes are created. When
axis provided, thefigsizeanddpiarguments are ignored.- **kwargsdict
Other arguments that are passed to
mne.viz.plot_topomap.
- data
- Returns:
- fig
matplotlib.figure.Figure Matplotlib Figure
- fig
Examples
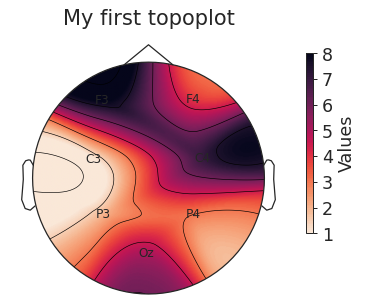
Plot all-positive values
>>> import yasa
>>> import pandas as pd
>>> data = pd.Series(
...     [4, 8, 7, 1, 2, 3, 5],
...     index=["F4", "F3", "C4", "C3", "P3", "P4", "Oz"],
...     name="Values",
... )
>>> fig = yasa.topoplot(data, title="My first topoplot")
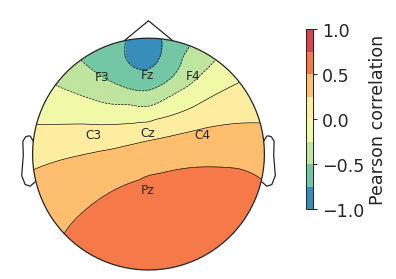
Plot correlation coefficients (values ranging from -1 to 1)
>>> import yasa
>>> import pandas as pd
>>> data = pd.Series(
...     [-0.5, -0.7, -0.3, 0.1, 0.15, 0.3, 0.55],
...     index=["F3", "Fz", "F4", "C3", "Cz", "C4", "Pz"],
... )
>>> fig = yasa.topoplot(data, vmin=-1, vmax=1, n_colors=8, cbar_title="Pearson correlation")
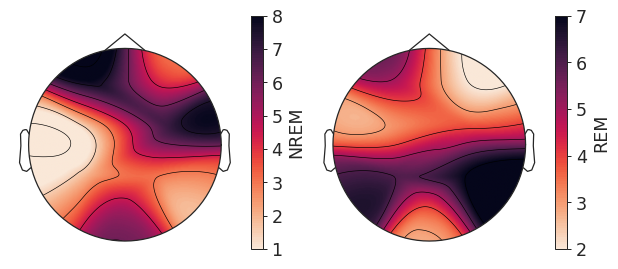
Plot two topoplots side-by-side using the
axparameter
>>> import yasa
>>> import pandas as pd
>>> import matplotlib.pyplot as plt
>>> data1 = pd.Series(
...     [4, 8, 7, 1, 2, 3, 5],
...     index=["F4", "F3", "C4", "C3", "P3", "P4", "Oz"],
...     name="NREM",
... )
>>> data2 = pd.Series(
...     [2, 5, 4, 3, 6, 7, 4],
...     index=["F4", "F3", "C4", "C3", "P3", "P4", "Oz"],
...     name="REM",
... )
>>> fig, axes = plt.subplots(1, 2, figsize=(8, 4))
>>> yasa.topoplot(data1, ax=axes[0])
>>> yasa.topoplot(data2, ax=axes[1])